IdahoMtnSpyder
Active member
I'm doing this poll mostly for fun with a 10 day time frame. But in all seriousness I also would like for us to get an idea of just how meaningless some of our debates over gas mileage really can be!
This is in follow up to this thread http://www.spyderlovers.com/forums/showthread.php?109130-Average-MPG-Display where I said keeping track of MPG of a Spyder is pretty much an exercise in futility and I would post graphs showing why I say that. Here are four graphs of my MPG for the summer riding seasons of 2016 and 2017. Pay attention to the Y axis scale. It's not the same on all four graphs in order to make the variation in MPG more clear.
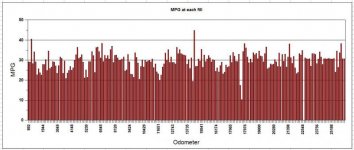
This one is my MPG at each fill up.

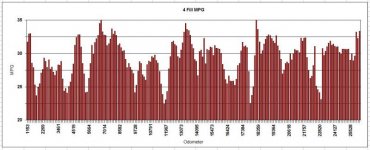
This one is the running average MPG over 4 fills.

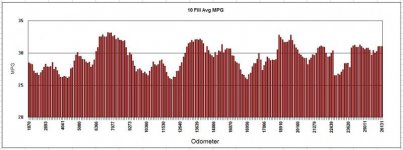
This one is the running average MPG over 10 fills. Even over 10 fills MPG varies, but naturally not nearly as much as fill to fill.

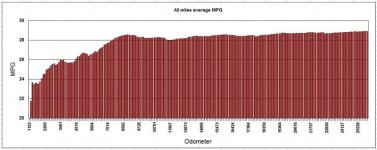
And this one is the average over all the miles on the Spyder.

As you can see gas mileage goes up and down like a kid on a trampoline. The only one that is really informative is the all mileage average, and in my case it is constantly changing. Now, can you tell from the graphs above which season I ran premium gas and which season I ran regular? Many of the members here have vigorously argued they can clearly tell a difference. My driving habits have been basically the same each season and the Spyder has been the same each season. I do have an F4 tall and wide windshield which is full up most all the time, so that undoubtedly has an impact on mileage. Most of my driving is on highways at 70+ MPH. As we all know, speed hurts MPG!
I also had one long trip pulling a trailer. Can you tell when it was?
This is in follow up to this thread http://www.spyderlovers.com/forums/showthread.php?109130-Average-MPG-Display where I said keeping track of MPG of a Spyder is pretty much an exercise in futility and I would post graphs showing why I say that. Here are four graphs of my MPG for the summer riding seasons of 2016 and 2017. Pay attention to the Y axis scale. It's not the same on all four graphs in order to make the variation in MPG more clear.
This one is my MPG at each fill up.

This one is the running average MPG over 4 fills.

This one is the running average MPG over 10 fills. Even over 10 fills MPG varies, but naturally not nearly as much as fill to fill.

And this one is the average over all the miles on the Spyder.

As you can see gas mileage goes up and down like a kid on a trampoline. The only one that is really informative is the all mileage average, and in my case it is constantly changing. Now, can you tell from the graphs above which season I ran premium gas and which season I ran regular? Many of the members here have vigorously argued they can clearly tell a difference. My driving habits have been basically the same each season and the Spyder has been the same each season. I do have an F4 tall and wide windshield which is full up most all the time, so that undoubtedly has an impact on mileage. Most of my driving is on highways at 70+ MPH. As we all know, speed hurts MPG!
I also had one long trip pulling a trailer. Can you tell when it was?
Last edited:
