IdahoMtnSpyder
Well-known member
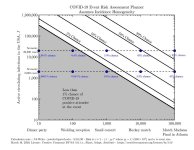
Came across this interesting graph today put out by a biologist & professor at Georgia Institute of Technology. It shows the probability of contracting Covid-19 based on how large the gathering is and how many cases of Covid-19 there are in all of the US. Since we are at over 600,000 cases nationwide go horizontally from the point where the 2% line crosses the Y-axis. This graph assumes Covid-19 cases are uniformly dispersed around the country. This is, of course not the case. Your risk factor will be less than what the graph shows if you are in a rural area, and higher in metropolitan areas. Based on the graph if you get together with 20 other people you will today have about a 6% chance of getting infected. If you're in a group of about 1000 people you have a 90% chance of contracting Covid-19. This is why social distancing is so critical in keeping the probability of infection close to zero.


